Sometimes, you might have a hard time accessing certain websites, or you can’t connect to them at all. When that happens, your first instinct might be to call your internet service provider and ask them what’s causing the problem. However, you can do a little sleuthing on your computer and find out the reason for yourself. Here’s how to run a traceroute on a Mac to find out what’s slowing down your internet.
What Is Traceroute?
Traceroute is a command line utility for troubleshooting network connectivity issues. It’s like a map that shows you how data travels from your computer to the internet, and what stops it takes at each point.
Whenever you access a website on the internet, your data travels from your device to your router. Then that data is sent to other routers (or servers) across the world. Each time your data is sent to a new router, it is known as a hop. Running a traceroute lets you see all the hops your data makes and how long it takes between each hop. This way, you will know where your network issues are coming from.
Running a traceroute on your Mac can also tell you about your network latency. Latency is a measurement of how long it takes data to travel from your device to a website or server. If you are only concerned about network latency, check out our step-by-step guide on how to do a ping test on a Mac.
How to Run a Traceroute on a Mac
To run a traceroute on a Mac, open the Terminal app and type traceroute followed by a space and the website or IP address you want to test. Then hit Enter on your keyboard and wait for the traceroute to be completed.
Remember to run traceroute on the computer where you’re having difficulty reaching a website at the time that it is happening. Otherwise, you will have to wait again until you run into the issue in order to effectively use traceroute.
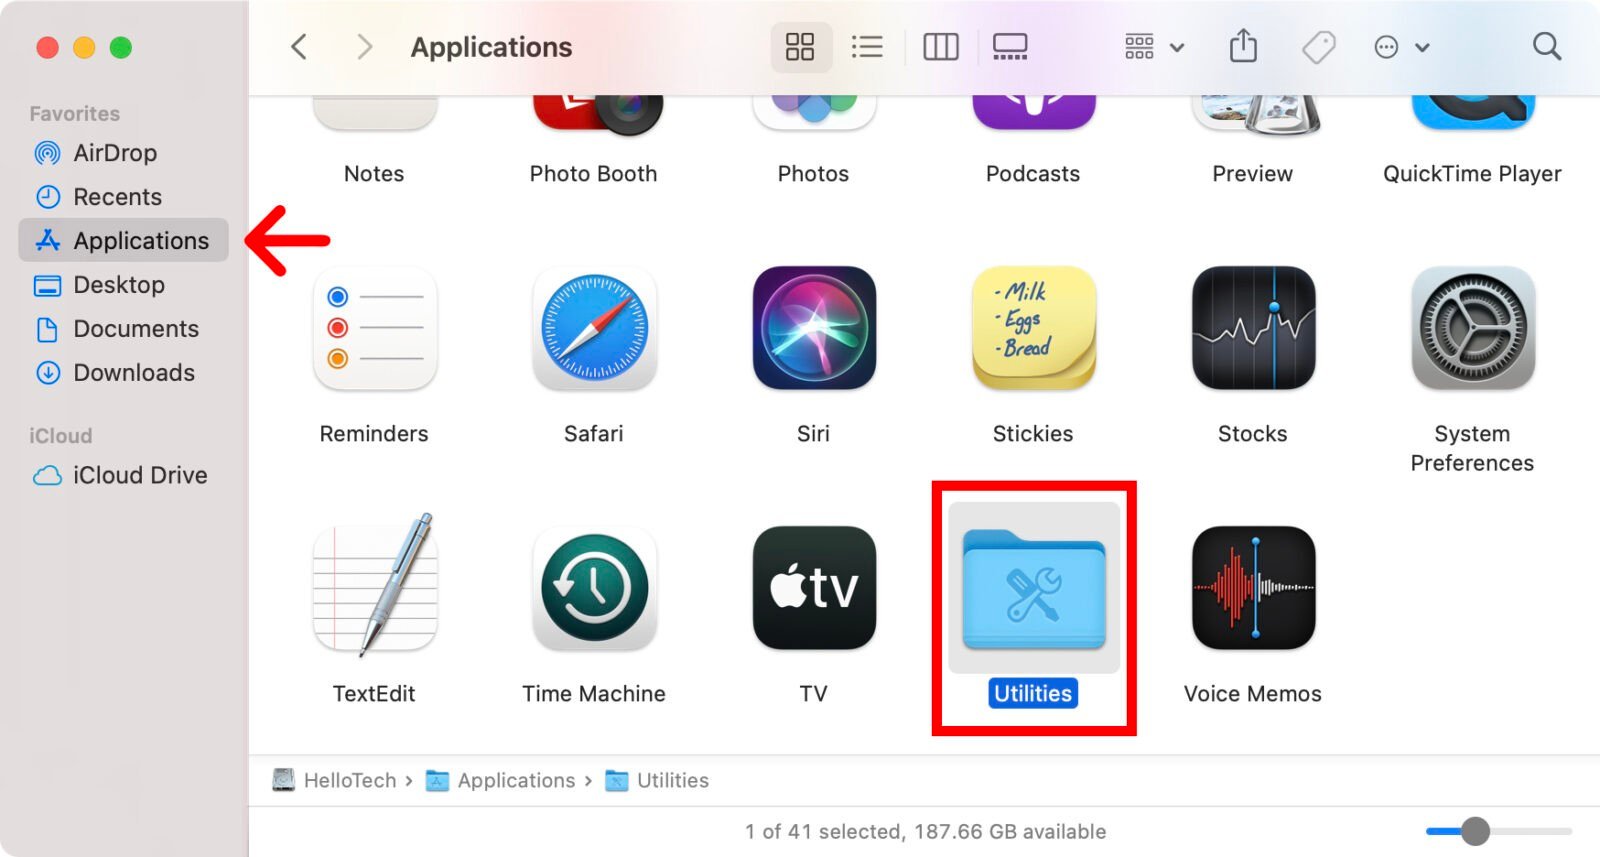
- Open the Applications folder on your Mac. You can do this by clicking on the half-blue, half-gray face icon in your Dock. Then look for the Applications folder in the left sidebar of the Finder window. Or you can click anywhere on your desktop and press the Command + Shift + A keys on your keyboard at the same time.
- Then open the Utilities folder.

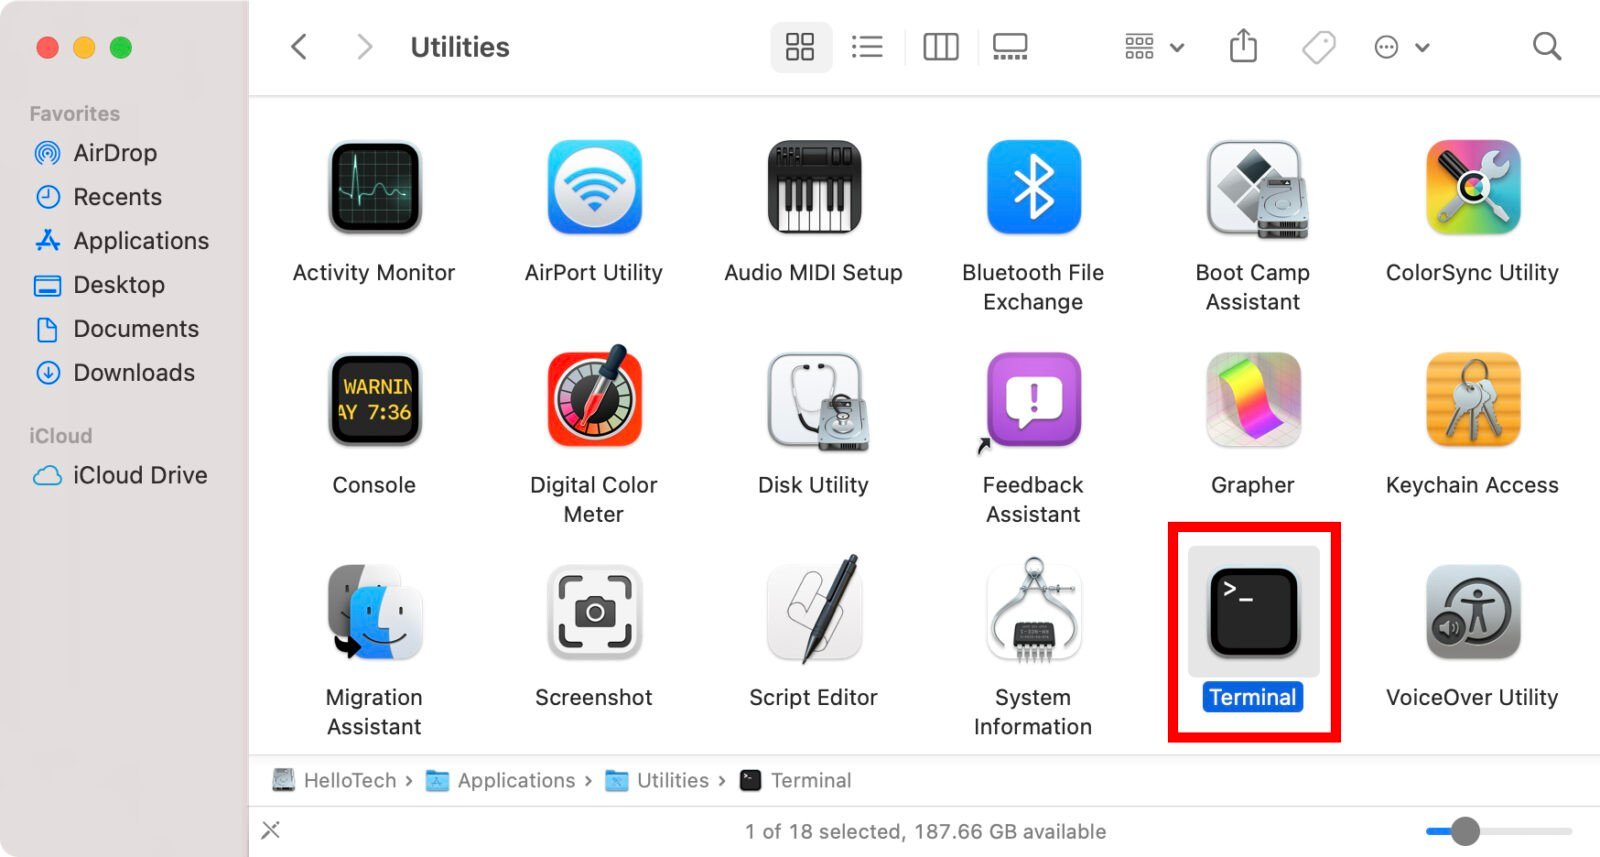
- Next, open the Terminal app.

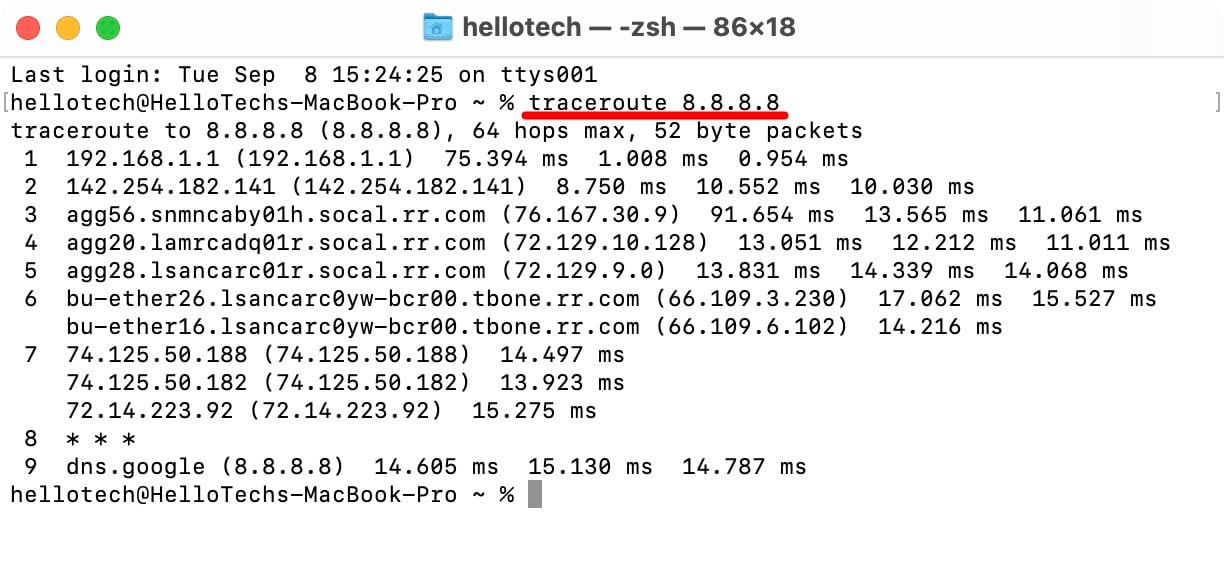
- Then type traceroute followed by a space and then a website or IP address. For example, you can enter traceroute 8.8.8.8 to test your connection with Google’s DNS servers. Or you can type traceroute hellotech.com or any other website to test your connection to that website.
- Finally, hit Enter on your keyboard and wait for the traceroute results. You will know that the traceroute is complete when you see your Mac’s name after the numbered traceroute results.

How to Read Your Traceroute Results on a Mac
To read your traceroute results, look for the round-trip times (RTTs) in each hop. If you see any hops that exceed 100 milliseconds (ms), it might indicate a network issue. You should also check for any error messages to see where your connection might be dropping off.
Traceroute results on your Mac will be divided into several rows and three columns:
- The number of hops: The first column of your traceroute results indicate how many routers the traceroute command was able to query. The first row will likely be your local router, which usually has an IP address that starts with 192.168 or 10.0. The next few hops in the middle can include routers from smaller regional internet service providers (ISPs) or bigger Tier 1 ISPs that process the request near the source. Finally, the last row will be the destination web server.
- Domain name: The second column indicates the URL and IP address of the router where your request passed through. Sometimes, it will include three-letter airport or geographic codes which will identify the router’s location. Other times, it will only indicate the router’s IP address.
- Round-trip Times: Round-trip times (RTT) are indicated in the third to fifth columns. The RTT tells you how long it takes in milliseconds for your request to travel from origin to destination, then back again to its origin. RTT is an indicator of how fast and reliable your network connection is. In the traceroute results, you will see three RTTs because the traceroute command queries each hop three times to ensure accuracy in measuring the average RTT.

You might see very different RTTs for certain hops. However, you won’t need to worry unless any of them exceed 150ms. Any hops that take longer can indicate a network issue.
Also, if you see a high RTT in the first few hops, it might be caused by an issue within your local network. Get in touch with your local network administrator to confirm and fix the problem.
Common Traceroute Error Messages
If there is an issue within your network, the traceroute results will also show error commands, which include Request timed out, three asterisks (***) in RTT columns, Destination net unreachable, and more.
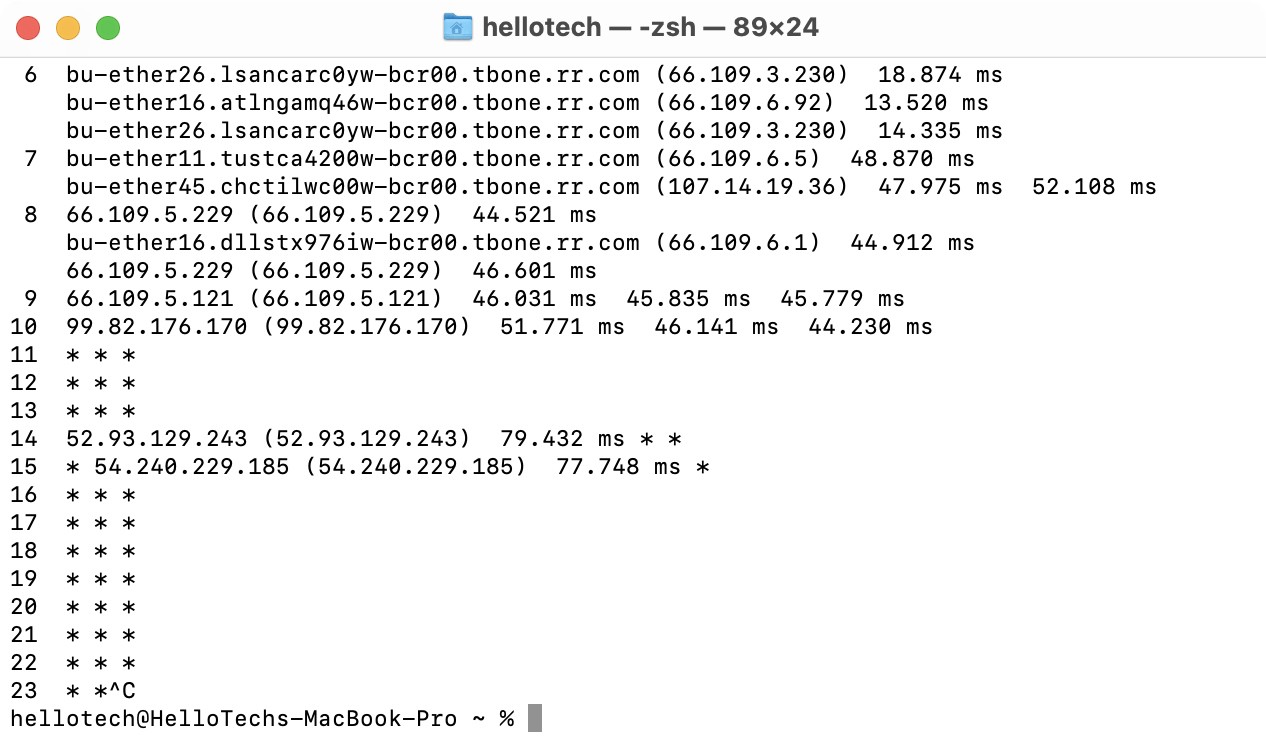
- Three asterisks (* * *): This is not an issue if it occurs at the beginning or middle hops, as long as the rest of the hops are successfully completed. However, it indicates an issue if it occurs at the destination server and does not show the IP address or server name. This could occur because of a network outage, network congestion, or a firewall interrupting traffic from your router.
- Destination net unreachable: This means a packet was dropped on the network. This might be because of misconfigured router settings or a nonexistent IP address.
- Request Timed Out: If you see this error message in the first few hops, you can ignore it. Some routers are not configured to respond to traceroute requests. However, if it happens in the last few hops, it might be a firewall blocking the request at the destination, a problem in the return route, or a system-related connection problem.

To stop a traceroute any time, just hit the Control + C keys on your keyboard at the same time.
If you’re still experiencing internet problems, the issue might be due to your network. Check out our article on why is my WiFi so slow to find out more.
